
A restaurant retention rate needs three things: a defined group of customers, a defined return event and enough time for everyone in the group to return. Without those definitions, two dashboards can show different numbers and both appear to be right.
For most restaurants starting with guest data, a useful first calculation is: What percentage of a fixed group returned at least once within 30 days of their first observed visit?
This guide shows that calculation, distinguishes it from other common metrics and provides spreadsheet rules you can reuse. Every numerical example is illustrative, not an industry benchmark or a VoqadoWiFi customer result.
Put this guide to work
Free worksheets, campaign templates and a venue growth calculator. No email gate.
Choose the question before choosing the formula
Four useful metrics answer different questions:
| Metric | Numerator | Denominator | What it answers |
|---|---|---|---|
| 30-day cohort return rate | Cohort members who return within 30 days | All cohort members with full follow-up | Did this group come back? |
| Period-to-period active retention | Customers active in both periods | Customers active in the first period | How much of the prior active base remained active? |
| Repeat-customer share | This period’s active customers with an earlier qualifying visit | All active customers this period | How much of this period’s audience was returning? |
| Visit frequency | Qualifying visits in the period | Unique active customers in the period | How often did active customers visit? |
Use “identified guest profiles” in place of “customers” when that is what your records measure. If your identifier is only a device address, use “devices.” Clear labels are more helpful than an impressive-looking percentage.
Calculator 1: Fixed-cohort return rate
Start with profiles whose first observed qualifying visit fell within a chosen month. Give every profile the same amount of follow-up measured from its own index visit.
30-day return rate = profiles with at least one later qualifying visit within 30 days ÷ eligible cohort profiles × 100.
Illustrative example:
- 200 profiles have a first observed visit during January
- All 200 have a complete 30-day follow-up window
- 70 have at least one qualifying return within that window
- 30-day return rate = 70 ÷ 200 × 100 = 35%
A guest who returns four times counts once in the numerator. Their additional visits belong in a frequency measure.
“First observed” matters. Someone may have eaten at the restaurant for years before first joining the WiFi or loyalty program. Unless you have sufficient historical evidence, label the cohort as newly observed profiles, rather than newly acquired customers.
The cohort approach is a general analytics method: define who enters a group and what counts as returning. Google Analytics documents those as separate inclusion and return criteria, although its online cohort report should not be mistaken for a restaurant attendance system. Google cohort documentation
Build the calculation in a guest-level worksheet
Use one row per profile and these columns:
| Column | Value |
|---|---|
| A | Stable guest or profile key |
| B | First observed local service date |
| C | Earliest later qualifying service date, or blank |
| D | Data cutoff date through which observation is complete |
| E | Full 30-day follow-up available: TRUE or FALSE |
| F | Return within 30 days: 1, 0, or blank if immature |
In this date-based example, a return must occur on a later local service day, up to and including day 30. A service day is your documented operating day; a meal spanning midnight should not accidentally become two visits.
For row 2:
- Maturity in E:
=D2>=B2+30 - Return flag in F:
=IF(E2,IF(AND(ISNUMBER(C2),C2>B2,C2<=B2+30),1,0),"") - Mature-cohort rate:
=IFERROR(SUM(F2:F201)/COUNT(F2:F201),"")
Format the final result as a percentage. Column C must contain the earliest qualifying return, not simply the latest recorded visit. If a guest returned on day 10 and again on day 45, using their latest visit alone would incorrectly mark the 30-day outcome as zero.
Build C from a cleaned event export, grouping by profile key and selecting the minimum qualifying service date greater than the index date. Remove staff, test devices, duplicate event rows and reconnects according to rules set in advance.
Do not score an unfinished cohort as zero
Suppose someone’s first observed visit is January 31. Their 30-day window is still open in mid-February. Including them as a non-returner at that point depresses the result unfairly.
The cleanest monthly comparison waits until every member of each monthly cohort has completed the same horizon. A live dashboard may also show a mature subset, but label its denominator clearly: “120 of 200 January profiles currently eligible for 30-day reporting.” Do not compare that partial subset with a complete month without considering its different composition.
If data collection failed during part of the window, maturity alone does not make observation complete. Flag the outage, investigate its effect and avoid silently treating unknown attendance as absence.
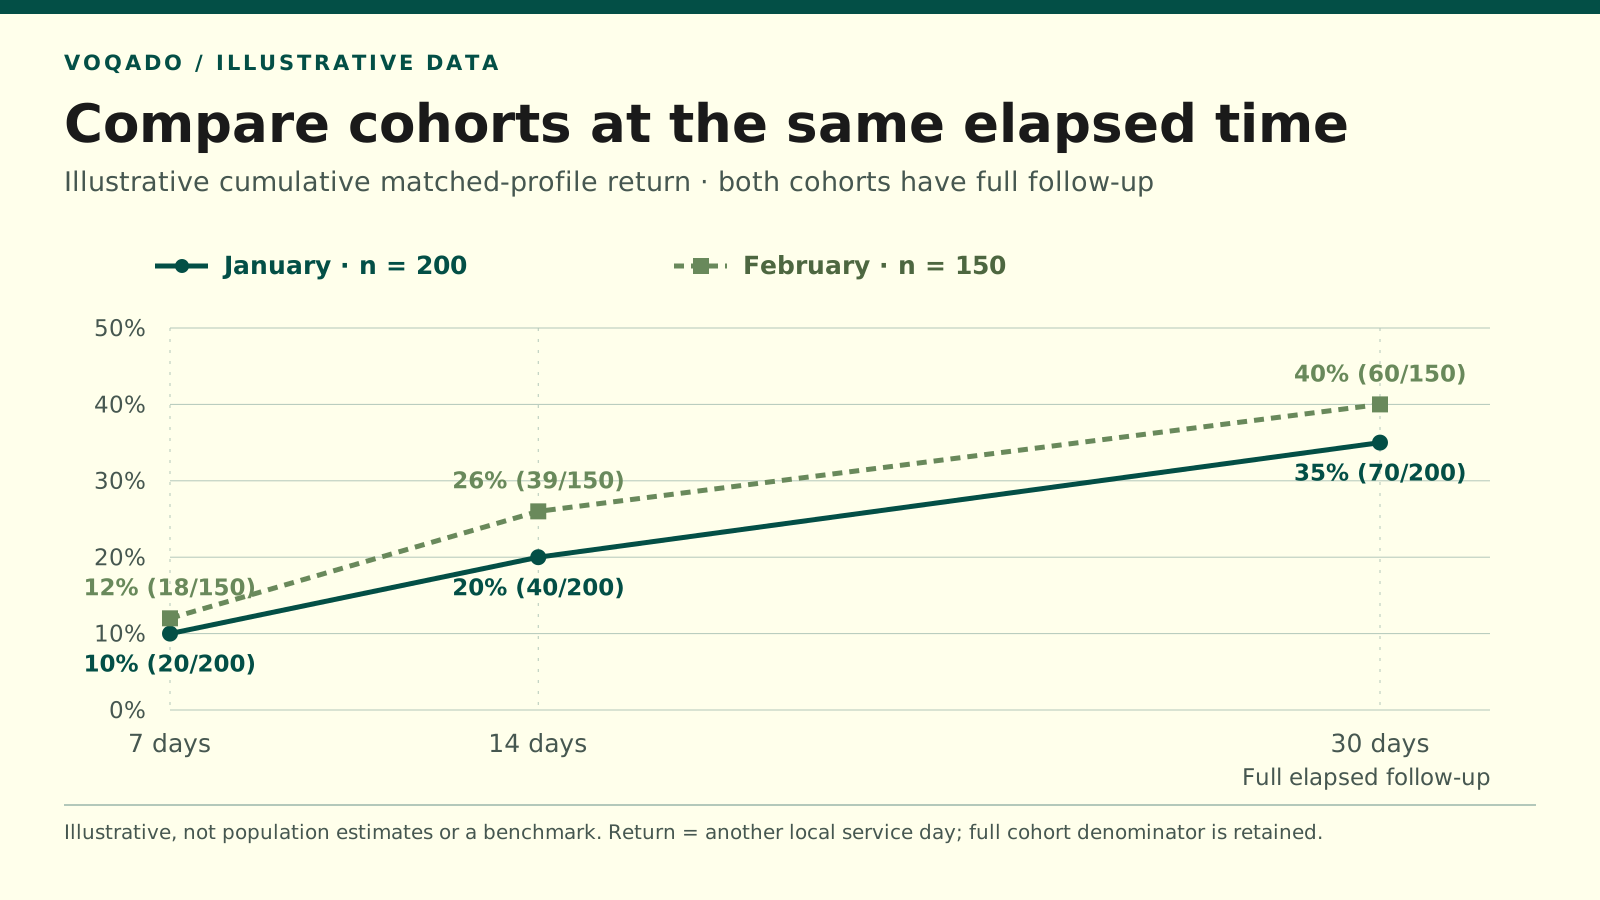
Illustrative cumulative matched-profile return at 7, 14 and 30 days. All cohorts are fully mature; this is not a restaurant-population estimate.
| Cohort | Cohort profiles | Elapsed days | Unique returners | Return rate percent |
|---|---|---|---|---|
| January | 200 | 7 | 20 | 10 |
| January | 200 | 14 | 40 | 20 |
| January | 200 | 30 | 70 | 35 |
| February | 150 | 7 | 18 | 12 |
| February | 150 | 14 | 39 | 26 |
| February | 150 | 30 | 60 | 40 |
Compare equal horizons
Here is an illustrative cumulative return table. Each percentage means at least one later qualifying return by that elapsed day. All cohorts have complete follow-up through day 30.
| First-observed cohort | Profiles | By day 7 | By day 14 | By day 30 |
|---|---|---|---|---|
| January | 200 | 20 / 200 = 10% | 40 / 200 = 20% | 70 / 200 = 35% |
| February | 150 | 18 / 150 = 12% | 39 / 150 = 26% | 60 / 150 = 40% |
Source and method: Invented examples calculated from fixed cohort denominators. Returns are matched profiles on another local service day. These are cumulative rates, not the percentage returning specifically on day 7, 14 or 30.
February’s 30-day rate is five percentage points higher. That is a descriptive difference. It does not prove that a new email sequence caused an improvement. Guest mix, events, seasonality and observation changes could contribute, and sampling uncertainty still matters.
Because these rates are cumulative, each row should stay flat or rise as the horizon lengthens. A falling row often signals changing denominators, mixed definitions or a calculation error. A month-specific activity curve can fall; it answers a different question.
Calculator 2: Active-customer retention
For two comparable periods, use set membership:
Active retention = distinct customers active in both periods ÷ distinct customers active in the first period × 100.
If 300 identified customers visited in April and 120 of those also visited in May, April-to-May active retention is 40%.
This includes established customers, not just newly observed ones. It also depends on the period length. A monthly measure suits some dining habits better than others, so keep the period fixed when tracking a trend.
The familiar formula (ending customers − new customers) ÷ starting customers works only when those counts describe compatible customer sets. In a non-subscription restaurant, older lapsed customers can reactivate. They are neither brand-new nor necessarily part of the prior period’s active group.
For example, May has 260 active customers: 120 retained from April, 90 genuinely new and 50 reactivated from earlier months. Subtracting only the 90 new customers gives 170 ÷ 300 = 56.7%, overstating April-to-May retention. The direct intersection gives the correct 120 ÷ 300 = 40%.
Calculator 3: Repeat share and frequency
Using the same example, May’s repeat-customer share is (120 retained + 50 reactivated) ÷ 260 active = 65.4%. That describes May’s audience composition; it is not April’s retention rate.
If those 260 customers made 390 qualifying visits in May, visit frequency is 390 ÷ 260 = 1.5 visits per active customer. A person can raise visit frequency by coming more often without changing the count of retained customers.
Keep these measures alongside revenue and operational results. A rising repeat share can reflect weaker new-customer acquisition as well as healthier retention.
What WiFi data changes
A WiFi session is not a customer, and a network disconnect is not a confirmed departure. Private device addresses can rotate; Apple documents why a device may present different identifiers over time. Apple private-address guidance
Authenticated profile matching may reduce some fragmentation, but shared addresses, multiple accounts and visits without WiFi remain limitations. Do not ask guests to disable privacy features to improve your reporting.
Report the measured population, identity rule, history coverage and known outages beside the rate. WiFi guests may differ from guests who never connect, so avoid presenting their retention rate as a complete restaurant census.
Turn the number into an operating decision
Start with one mature cohort and investigate unexpected changes before sending more promotions. Check whether hours, menu availability, service quality, acquisition sources or data capture changed.
If you test an email intervention, send only to appropriately permissioned contacts and honor unsubscribe requests. Use a randomized holdout to estimate campaign impact; descriptive cohort improvement alone is insufficient.
For an Omada or UniFi deployment using VoqadoWiFi, first verify the identity and visit-history fields available in your exports. The goal is a repeatable answer you can trust: which defined group came back, within which window, according to which evidence?
Share this article