
A restaurant dashboard showing 180 “unique devices” has not established that 180 different people visited. Some diners bring two devices, some never join WiFi, and some devices change the address the network sees.
Private WiFi addresses make that last distinction especially important. They do not make guest analytics useless. They require you to separate network observations, submitted contact records, and real-world visits before making a business decision.
Start by asking what each chart counts. If the answer is simply “guests,” ask how a guest is recognized and how repeat connections are handled.
Put this guide to work
Free worksheets, campaign templates and a venue growth calculator. No email gate.
What a private WiFi address changes
A MAC address identifies a network interface at the local network level. Historically, using a persistent hardware address made it easier to relate observations of that interface over time. Modern devices can use private or randomized addresses to reduce that linkability.
Apple documents different private addresses for different WiFi networks. On its newer operating systems, including iOS 18 and later, the available modes include Fixed and Rotating. Fixed remains private without periodic rotation; Rotating changes periodically. Apple says newly joined networks with WPA2 or stronger security default to Fixed, while weaker or open networks default to Rotating, with a two-week rotation interval. These are Apple’s documented conditions, not a universal rule for every phone. Apple’s private-address documentation
Android’s framework defaults to persistent randomization, with non-persistent randomization available under specified conditions. Persistent randomization does not mean using the factory address, and “randomized” does not necessarily mean “new on every connection.” Manufacturer implementation and network configuration matter. Android’s MAC-randomization behavior
Windows also supports random hardware addresses where the WiFi hardware supports them, with controls for all networks or a particular network. Microsoft’s WiFi documentation
The operational consequence is straightforward: an observed address is not a permanent person identifier. Do not build your reporting around the assumption that it is.
Define four different units before opening the dashboard
A connection or session is an event with a start and some definition of an end. Your network or portal decides when reconnection, idle timeout, or reauthorization creates another event.
An observed device address is an address recorded during a chosen period. It can help connect events where the address remains stable, but it does not guarantee a durable device identity or a person.
A contact record is information someone submitted, such as an email address, handled under your platform’s identity and deduplication rules. It may support recognition across devices when the same information is supplied. An unverified address can still contain a typo or belong to someone else; a shared address is not a unique person.
A diner visit is a real-world occurrence. One person can generate several sessions during one visit, or none. WiFi records alone do not tell you how many people were at a table or whether someone bought anything.
These units can all be useful. The trouble starts when a chart silently changes from one to another.
A small example shows why the units matter
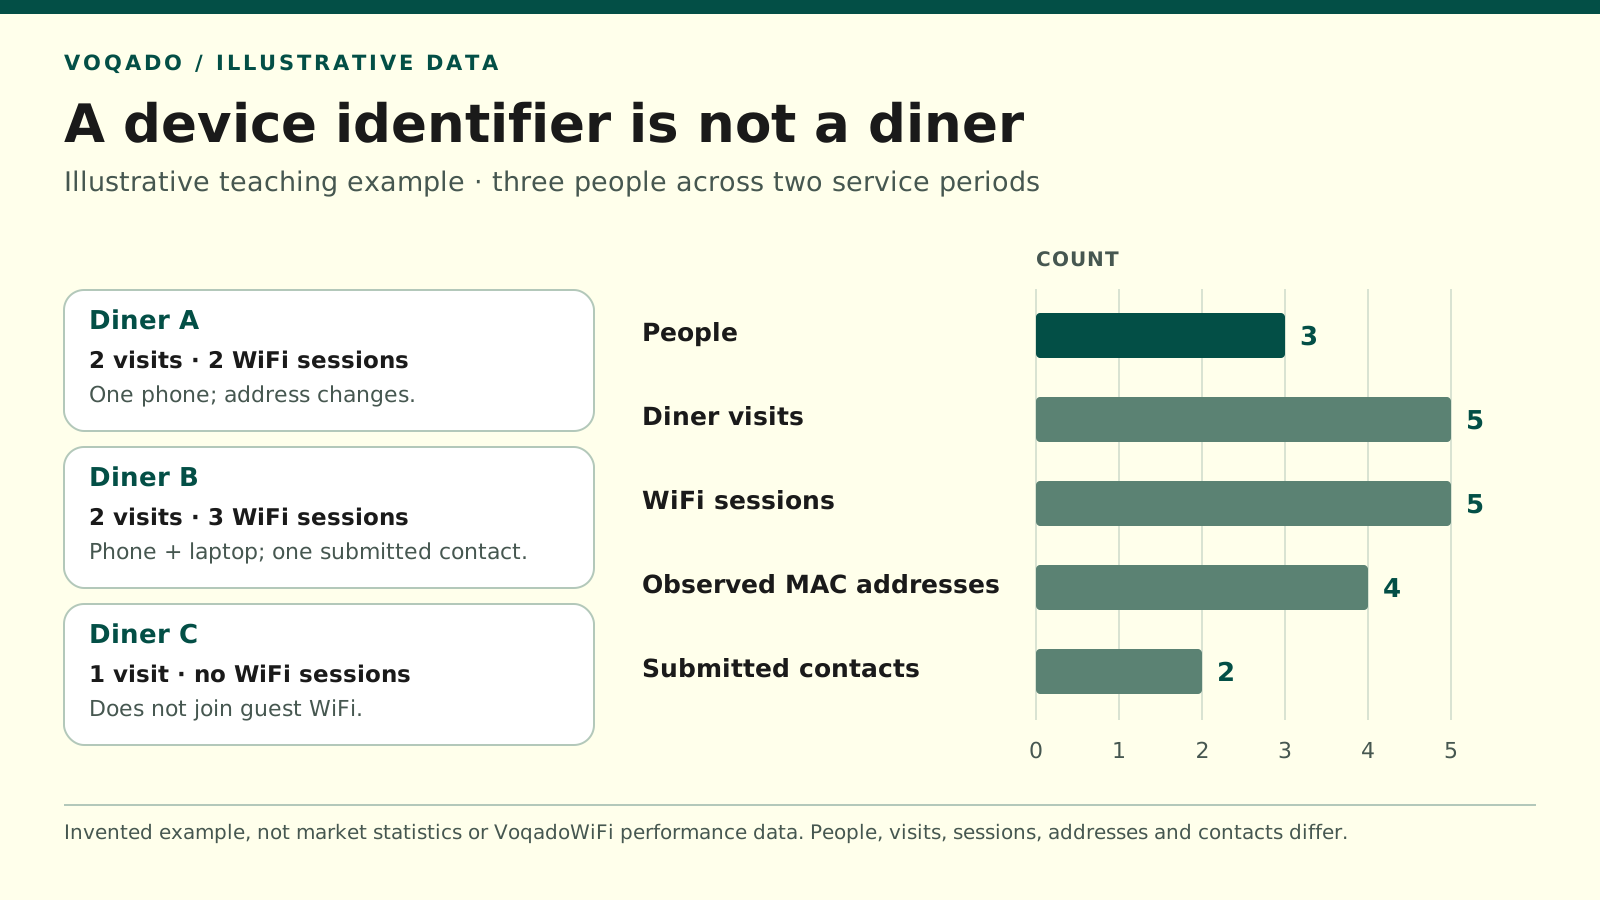
Invented teaching example across two service periods. Three people produce five diner visits, five WiFi sessions, four observed MAC addresses and two submitted contact records. These are different units, not market statistics or VoqadoWiFi performance data.
Consider an invented example across two service periods:
| Person | Diner visits | WiFi sessions | Observed MAC addresses | Submitted contact records |
|---|---|---|---|---|
| Diner A: one phone, address changes between visits | 2 | 2 | 2 | 1 |
| Diner B: phone and laptop, same submitted contact | 2 | 3 | 2 | 1 |
| Diner C: never joins the WiFi | 1 | 0 | 0 | 0 |
| Total: three people | 5 | 5 | 4 | 2 |
These are teaching numbers, not customer results or an industry benchmark. The example deliberately shows why a single “guest count” is ambiguous.
Four observed addresses would overstate the three distinct people in this scenario. Two contact records would understate them. Five WiFi sessions happens to equal five diner visits, but the rows show that the equality is accidental: one person has an extra device session while another has no session at all.
There is no defensible universal multiplier that converts these addresses into diners. The relationship changes with adoption, devices per person, session rules, and address behavior.
Which metrics can still support useful decisions?
Portal performance for the people who reached it
You can measure whether recorded portal starts lead to completed submissions, provided your event definitions are clear and duplicate events are handled consistently. Use that result to investigate page failures or unnecessary form friction.
Call it “completion among recorded portal starts.” Do not label it the percentage of all diners who joined WiFi unless you have a reliable diner denominator from another source.
A changing device address need not invalidate an individual login attempt. It does make cross-session matching a separate problem that requires its own rules.
Known-contact return activity
Where your platform can match a submitted contact record across sessions, you can examine repeat activity among those matched records. State the matching basis and observation period.
A useful label is “contacts with a recorded login on a later service day.” That avoids automatically counting an afternoon reconnect as another restaurant visit. It also makes clear that someone who returns without logging in is outside the observation.
Do not call this total restaurant retention. It is return activity within the population you can recognize through the selected method.
Demand and reliability patterns
Hourly session starts, concurrent connected clients, and login failures can help your team understand the load on the guest service. They are operational signals about WiFi use.
Use them to ask targeted questions: did failures rise after a configuration change? Does the guest network become busy during lunch? Does one AP account for a cluster of unsuccessful attempts?
Treat comparisons cautiously when network coverage, session duration, access rules, or the portal flow changed. A measurement change can move the chart even when the dining room did not change.
A contact list you can actually maintain
Submitted contact records can support a useful list when you manage duplicates, invalid addresses, preferences, and opt-outs. Keep permission records and network access records distinct in your reporting. A successful connection is not itself evidence that a person chose every future marketing use.
VoqadoWiFi describes its core role as an external Omada/UniFi portal that captures guest information and keeps guest data exportable. When evaluating analytics, ask which identifiers and event definitions underlie the specific report you intend to use. VoqadoWiFi product overview
What WiFi records should not promise on their own
Avoid presenting address counts as exact footfall, sessions as exact visits, or connection duration as exact time spent dining. A device can remain connected while its owner moves elsewhere within coverage, stop sending useful events while still on site, or reconnect more than once.
Likewise, a login does not establish a purchase, spend, or campaign-driven return. Those questions need appropriate transaction or booking evidence and a defined matching method. Even a matched purchase after an email does not, by itself, prove the email caused it.
Changing an SSID, security mode, retention window, or identity rule may also affect comparability. Mark those dates on the report. Otherwise, a reporting artifact can look like a sudden improvement in acquisition or a collapse in returning guests.
Make a one-page measurement contract
For each metric your manager uses, write down five things:
- Unit: session, observed address, submitted contact, or transaction.
- Population: which location, network, and participating users are included.
- Window: timezone, date range, and treatment of service that crosses midnight.
- Matching rule: how repeated events become one record, if they do.
- Known gaps: non-users, address changes, shared contacts, missing events, or unverified submissions.
Then add the decision the metric is allowed to support. “Investigate login errors after 6 p.m.” needs different evidence from “reduce staffing because footfall fell.” The more consequential the decision, the more important an independent check becomes.
Keep the definition stable while comparing periods. If you change it, show the break rather than merging the old and new series into one apparently continuous trend.
Keep privacy features enabled
Asking guests to disable private addresses so a dashboard can recognize them is a poor measurement strategy. Apple recommends retaining private addresses on networks that support them. Build your service around the current connection and make the limits of longer-term matching explicit. Apple’s guidance
For troubleshooting, use controlled venue devices and inspect the current client address. For business analysis, prefer clearly defined aggregates and appropriately collected contact records. Collect only the fields needed for the stated purpose, limit access, and set a retention policy with the appropriate privacy advice for your venue.
The goal is a report your team can trust. A smaller, clearly defined group of known contacts can be more useful than a large “unique guests” figure whose meaning changes every time a device presents a different address.
Share this article