
Thirty-six guests received your email and subsequently returned. How many would have returned anyway?
A campaign report cannot answer that by counting opens, clicks or redemptions. A practical way to estimate the difference is to randomly withhold the campaign from part of the same eligible audience, then measure both groups over the same period.
This guide provides a worksheet you can execute with exports. It does not assume a native connection between your guest WiFi system and POS. All numerical results below are illustrative, not customer data or performance benchmarks.
Put this guide to work
Free worksheets, campaign templates and a venue growth calculator. No email gate.
1. Write the test question before sending
Use a specific question:
“Among eligible marketing subscribers last observed 45–90 days ago, does one menu-update email increase the proportion with a matched return during the next 14 days?”
Those thresholds are example design choices. Select your own before seeing results, based on the restaurant’s normal dining cycle and the decision you need to make.
Fill in this test card:
| Field | Example definition |
|---|---|
| Eligible audience | Permissioned, contactable profiles; last observed 45–90 days ago |
| Experimental unit | One deduplicated guest profile |
| Treatment | One specified menu-update email |
| Control | No version of that campaign |
| Assignment | Random 50/50 split within the eligible list |
| Primary outcome | At least one matched return during 14 days |
| Observation window | Send timestamp through, but excluding, timestamp plus 14 days |
| Analysis population | Everyone randomly assigned, in their original group |
| Decision rule | Assess uncertainty, economics and data quality at the planned end |
The general rationale for randomized controls is well established: random assignment supports causal comparison in a way that selecting “similar” non-recipients does not. Restaurant execution still needs reliable identity and outcome measurement. Kohavi and colleagues’ practical guide
2. Choose what your data can actually observe
Use the strongest lawful, consistently collected identity available. A stable, appropriately collected loyalty or guest-account identifier is more useful than treating every MAC address as a person.
Apple devices can use private WiFi addresses that change. A person may also use two devices, share an email address or visit without connecting. Therefore, a WiFi-only test measures observed matched returns among the enrolled profiles, not every customer’s return behavior. Apple private-address documentation
Use the same observation rule for both groups. An email that encourages recipients to reconnect to WiFi could increase recorded returns without increasing actual visits. If reconnecting is part of the intervention, independent transaction or attendance evidence is especially important.
Define a visit separately from a session. Several reconnects during dinner should not create several visits. Document your local service-day boundary and deduplication rule; keep them fixed through the test.
3. Freeze the audience and random assignment
Export the eligible list immediately before assignment. Resolve duplicate profiles and known shared identities first. Exclude staff and test accounts using rules established before the campaign.
In a spreadsheet, add a random value to every eligible row, copy those values and paste them back as fixed values. Sort by the frozen random column, then assign half the rows to Email and half to Holdout. Save the file before sending. Do not leave a live random function that reassigns people when the sheet recalculates.
For multiple locations or materially different recency groups, randomize within each group and combine results using a preplanned analysis. Known members of the same household or dining party may influence one another; consider assigning them together. That changes the statistical unit and requires an analysis that accounts for clustering.
Use suppression lists to keep holdout members out of this campaign and duplicate versions of it. Keep unrelated routine communications comparable, log overlapping promotions and do not withhold essential service messages.
4. Build one row per assigned profile
Keep the analysis sheet deliberately small:
| Column | Meaning |
|---|---|
| A: guest_key | Stable internal identifier; avoid unnecessary contact details |
| B: assigned_arm | Email or Holdout, fixed at randomization |
| C: index_time | Planned send timestamp, also used for Holdout |
| D: returned_14d | 1 for at least one qualifying matched return; otherwise 0 |
| E: net_contribution_14d | Optional sum of matched contribution across the window |
| F: observation_status | Complete, unresolved identity or known data outage |
Keep a separate event sheet with guest key, event timestamp, service date and source. Join qualifying events to the assignment sheet; collapse them to one binary return flag per profile. A guest with three returns contributes one to the primary returner count. Track total visits as a separate secondary outcome if useful.
Email delivery and opens belong in diagnostic columns. Do not remove bounced recipients or people who never opened the email from the primary denominator after randomization. An intention-to-treat analysis estimates the effect of assigning the campaign under actual delivery conditions.
Apple’s Mail Privacy Protection also limits whether a sender can tell if a message was opened, making opens a poor basis for defining the analysis population. Apple Mail Privacy Protection
5. Calculate the result
Suppose all 400 profiles have complete observation under your defined measurement method:
| Assigned group | Profiles | Observed returners | Return rate |
|---|---|---|---|
| 200 | 36 | 18% | |
| Holdout | 200 | 24 | 12% |
Source and method: Illustrative arithmetic. One randomized assignment per profile, one binary matched-return outcome, identical 14-day windows. These are not observed VoqadoWiFi results.
For each group, return rate = observed returners ÷ assigned profiles.
The estimated absolute effect is 18% − 12% = 6 percentage points. Relative to the holdout rate, that is 6% ÷ 12% = 50% relative lift. Always show the absolute difference alongside relative lift.
Estimated extra returners in the 200-person Email group = 200 × 0.06 = 12. Do not describe all 36 returners as incremental, or call the 12 “extra visits”: the primary outcome counts people or profiles, not visit events.
For rows 2–401, spreadsheet calculations are:
- Email denominator:
=COUNTIF(B2:B401,"Email") - Email returners:
=SUMIF(B2:B401,"Email",D2:D401) - Repeat with
"Holdout"for the control group - Divide each returner total by its own denominator, then subtract the rates
Use those formulas only after checking that D contains valid binary outcomes and no unresolved records have silently become zeros.
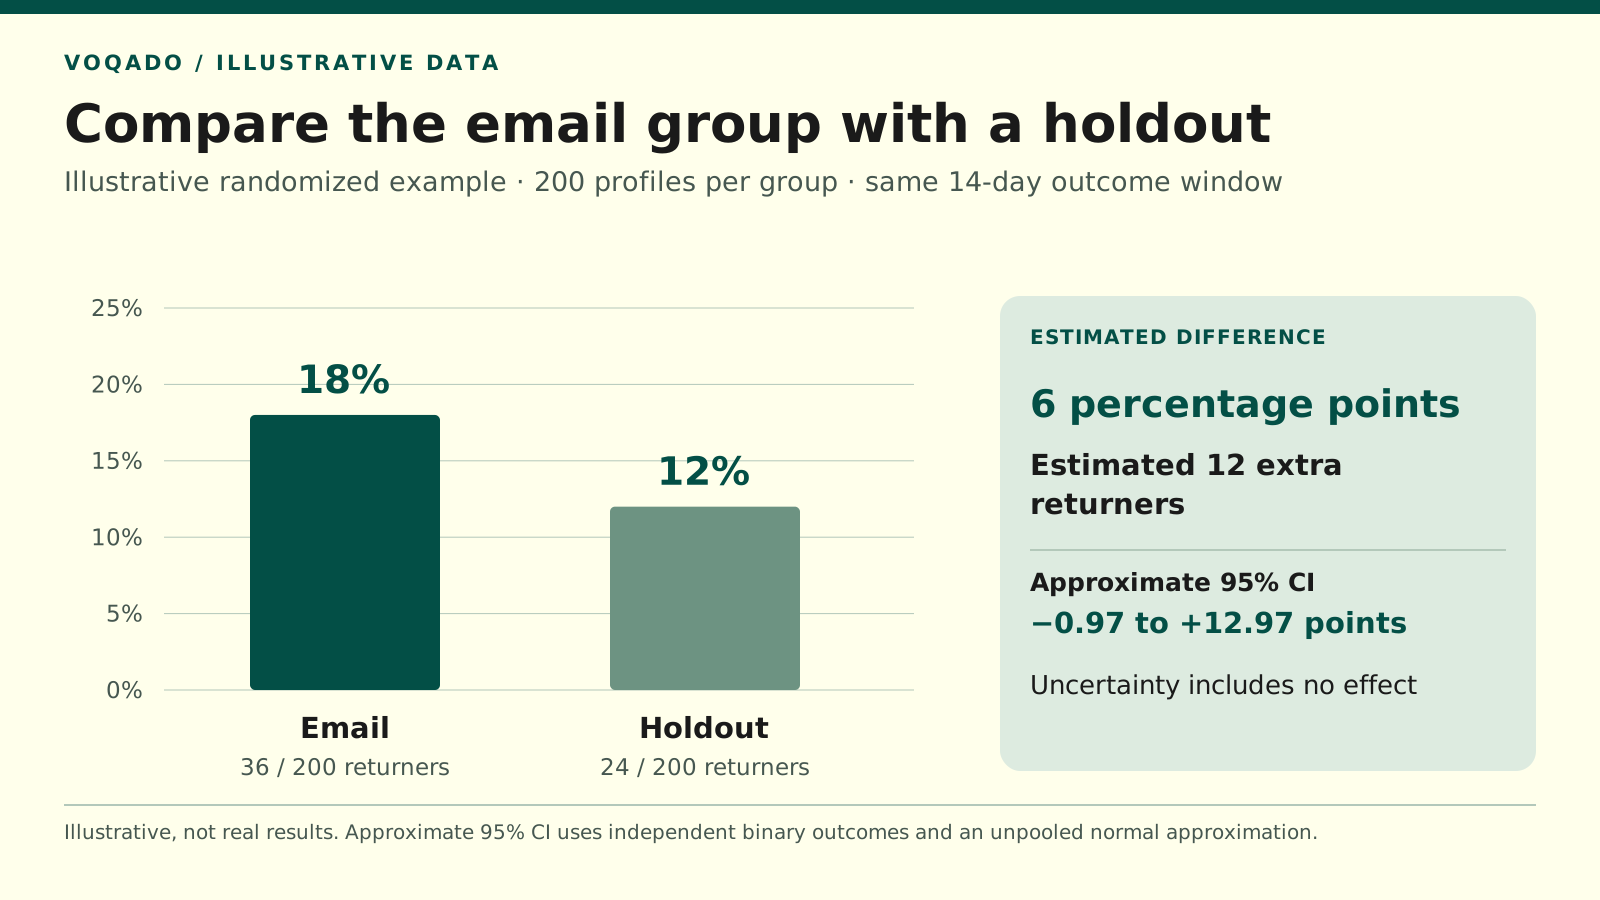
Illustrative randomized comparison: 18% versus 12% observed return, a 6 percentage-point estimated difference. Uncertainty includes no effect.
| Group | Assigned profiles | Observed unique returners | Return rate percent |
|---|---|---|---|
| 200 | 36 | 18 | |
| Holdout | 200 | 24 | 12 |
6. Put uncertainty next to the estimate
For this simple example with independent binary outcomes, an approximate standard error is:
SQRT(p_email*(1-p_email)/n_email + p_holdout*(1-p_holdout)/n_holdout)
An approximate 95% interval is the difference plus or minus 1.96 times that standard error. Here it is roughly −0.97 to +12.97 percentage points. The result is compatible with no effect as well as a useful positive effect. Report it as inconclusive, rather than declaring the campaign a proven winner.
Different methods are appropriate for small samples, extreme rates, stratified assignments or clustered guests. NIST documents methods for intervals on differences between proportions. NIST confidence-interval guidance
Plan sample size around the smallest effect worth detecting and your baseline rate. A 10% holdout is not automatically large enough. Avoid checking every day and stopping as soon as a favorable result appears; use the planned window and analysis, or a properly designed sequential method.
7. Measure economics without multiplying unlike units
Do not multiply extra WiFi profiles by average table spend and label the result measured revenue. One profile might represent one diner in a party, while the transaction belongs to someone else.
If you can reliably match purchases, compare mean net contribution per assigned profile. Include people with no purchases as zero and all qualifying purchases during the window. Deduct relevant variable costs, discounts and refunds consistently; avoid subtracting discounts twice if sales are already net of them.
Separate illustrative financial calculation: Suppose matched contribution totals $720 for Email and $540 for Holdout. Both groups contain 200 profiles. The mean difference is $3.60 − $2.70 = $0.90 per profile, or $180 across the Email group. With $100 of incremental campaign costs, estimated net benefit is $80.
That dollar estimate needs its own uncertainty assessment. The return-rate interval cannot be reused as a revenue interval. Without matched transactions, present scenario-based economics with explicit assumptions rather than measured financial impact.
8. Check for reasons the answer could be wrong
Before presenting a conclusion, inspect assignment balance, cross-group campaign exposure, identity failures, outages and unequal observation. Lack of a match means “no observed return” only when the defined observation process was operating; a missing export is not proof that nobody returned.
Respect opt-outs and data-protection requirements throughout the test. Marketing permission and permission or another lawful basis for measurement are separate questions; preserve only the records your policy permits.
For VoqadoWiFi deployments on Omada or UniFi, verify available export fields before planning the join. A defensible final sentence is: “The estimated effect was six percentage points among observed profiles over 14 days, with an interval that includes no effect.” That tells the team what was measured, what remains uncertain and why another planned test may be worthwhile.
Download the experiment worksheets
Use the profile-level CSV template, aggregate summary CSV, and field instructions to record the test described above. These are blank worksheets, not measured results.
Share this article